

Market are not as random as these appear to the uninitiated.
Some Chart Patterns are formed again and again and have specific characteristics.
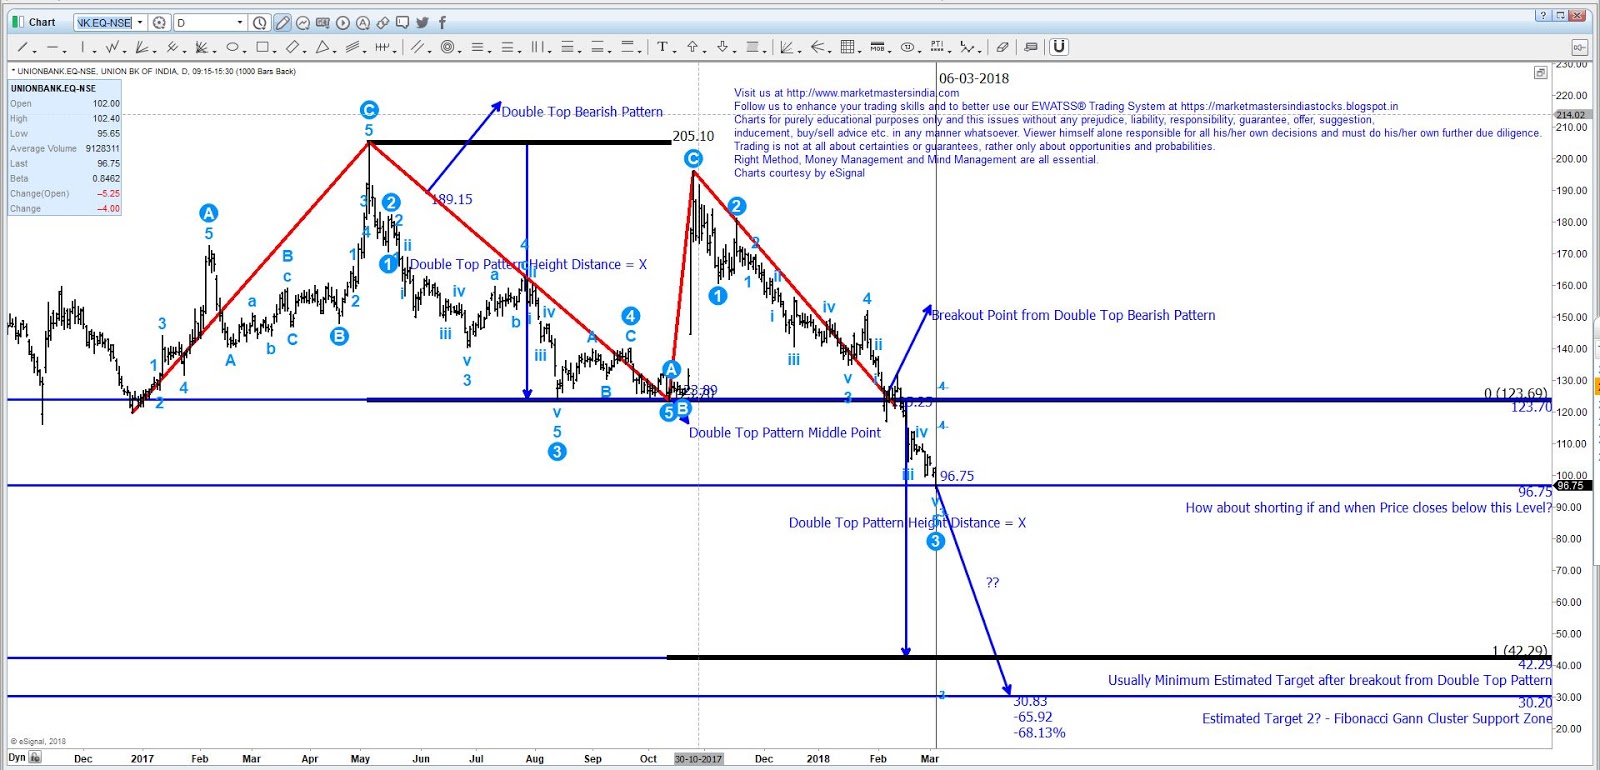
The technically pre-known Breakout Points (established by learned Market Technicians over years of observation) from these Chart Patterns provide good High Probability Entry Points for potentially successful trades.
The technically pre-known Measured Objectives (established by learned Market Technicians over years of observation) after Breakouts from these Chart Patterns provide good High Probability Target Points for potentially successful trades.
Aspiring Traders will be more comfortable about market's trend direction if, in addition to EWATSS® Trading System, they become aware of the Breakout Points (Trade Entry Points) and Measured Objectives (Target Points) following very few Chart Patterns (as these are also often marked on Charts uploaded on this Blog from time to time under 'Charts and Thoughts'):-
Bullish Chart Patterns (i.e Prices rise to Measured Objectives after Breakout Points from these Chart Patterns):-
Bearish Chart Patterns Patterns (i.e Prices fall to Measured Objectives after Breakout Points from these Chart Patterns):-
EWATSS® Trading System Reports assist you to locate good High Probability Breakout Points from such Chart Patterns.
Best wishes.
No comments:
Post a Comment